
We have updated our long-running empirical dataset on Web3 security, extending the study of public audit findings and real-world exploit incidents through 30 June 2026. The corpus now spans four and a half years: 25,706 audit findings from 22 security firms and 237 quality-filtered incidents from the rekt.news archive, totalling US$8.62 billion in documented losses. This article summarises what the new quarter adds, and what it reverses.
Three months ago the data suggested something unusual was happening. The first quarter of 2026 was the quietest opening of any year since our tracking began in 2022: sixteen incidents, US$136 million in losses, and, for the first time in the dataset, code-vector attacks dominating both incident count and dollar losses. Oracle manipulation led the quarter with seven incidents. Private-key compromise, the perennial number one, nearly vanished. It looked like a rotation in attacker behaviour.
It was not. The second quarter produced eighteen incidents and roughly US$854 million in losses, six times the Q1 figure and back in line with the 2022 to 2025 quarterly average. The composition reverted to exactly the pattern the last four years have taught us to expect. Private-key compromise was again the largest loss category: five incidents, about US$387 million, led by the US$200 million Drift Protocol theft on Solana and the US$170 million Humanity Protocol compromise. Bridge exploits were the most frequent serious category: six incidents, about US$344 million, led by the US$290 million KelpDAO restaking bridge event. A single supply-chain compromise at Resolv Labs added US$80 million. Human-vector attacks took 54.6 percent of the quarter’s losses. Oracle manipulation, Q1’s leading category, contributed one incident worth roughly US$2 million.
One quarter of quiet was noise. The structure held.
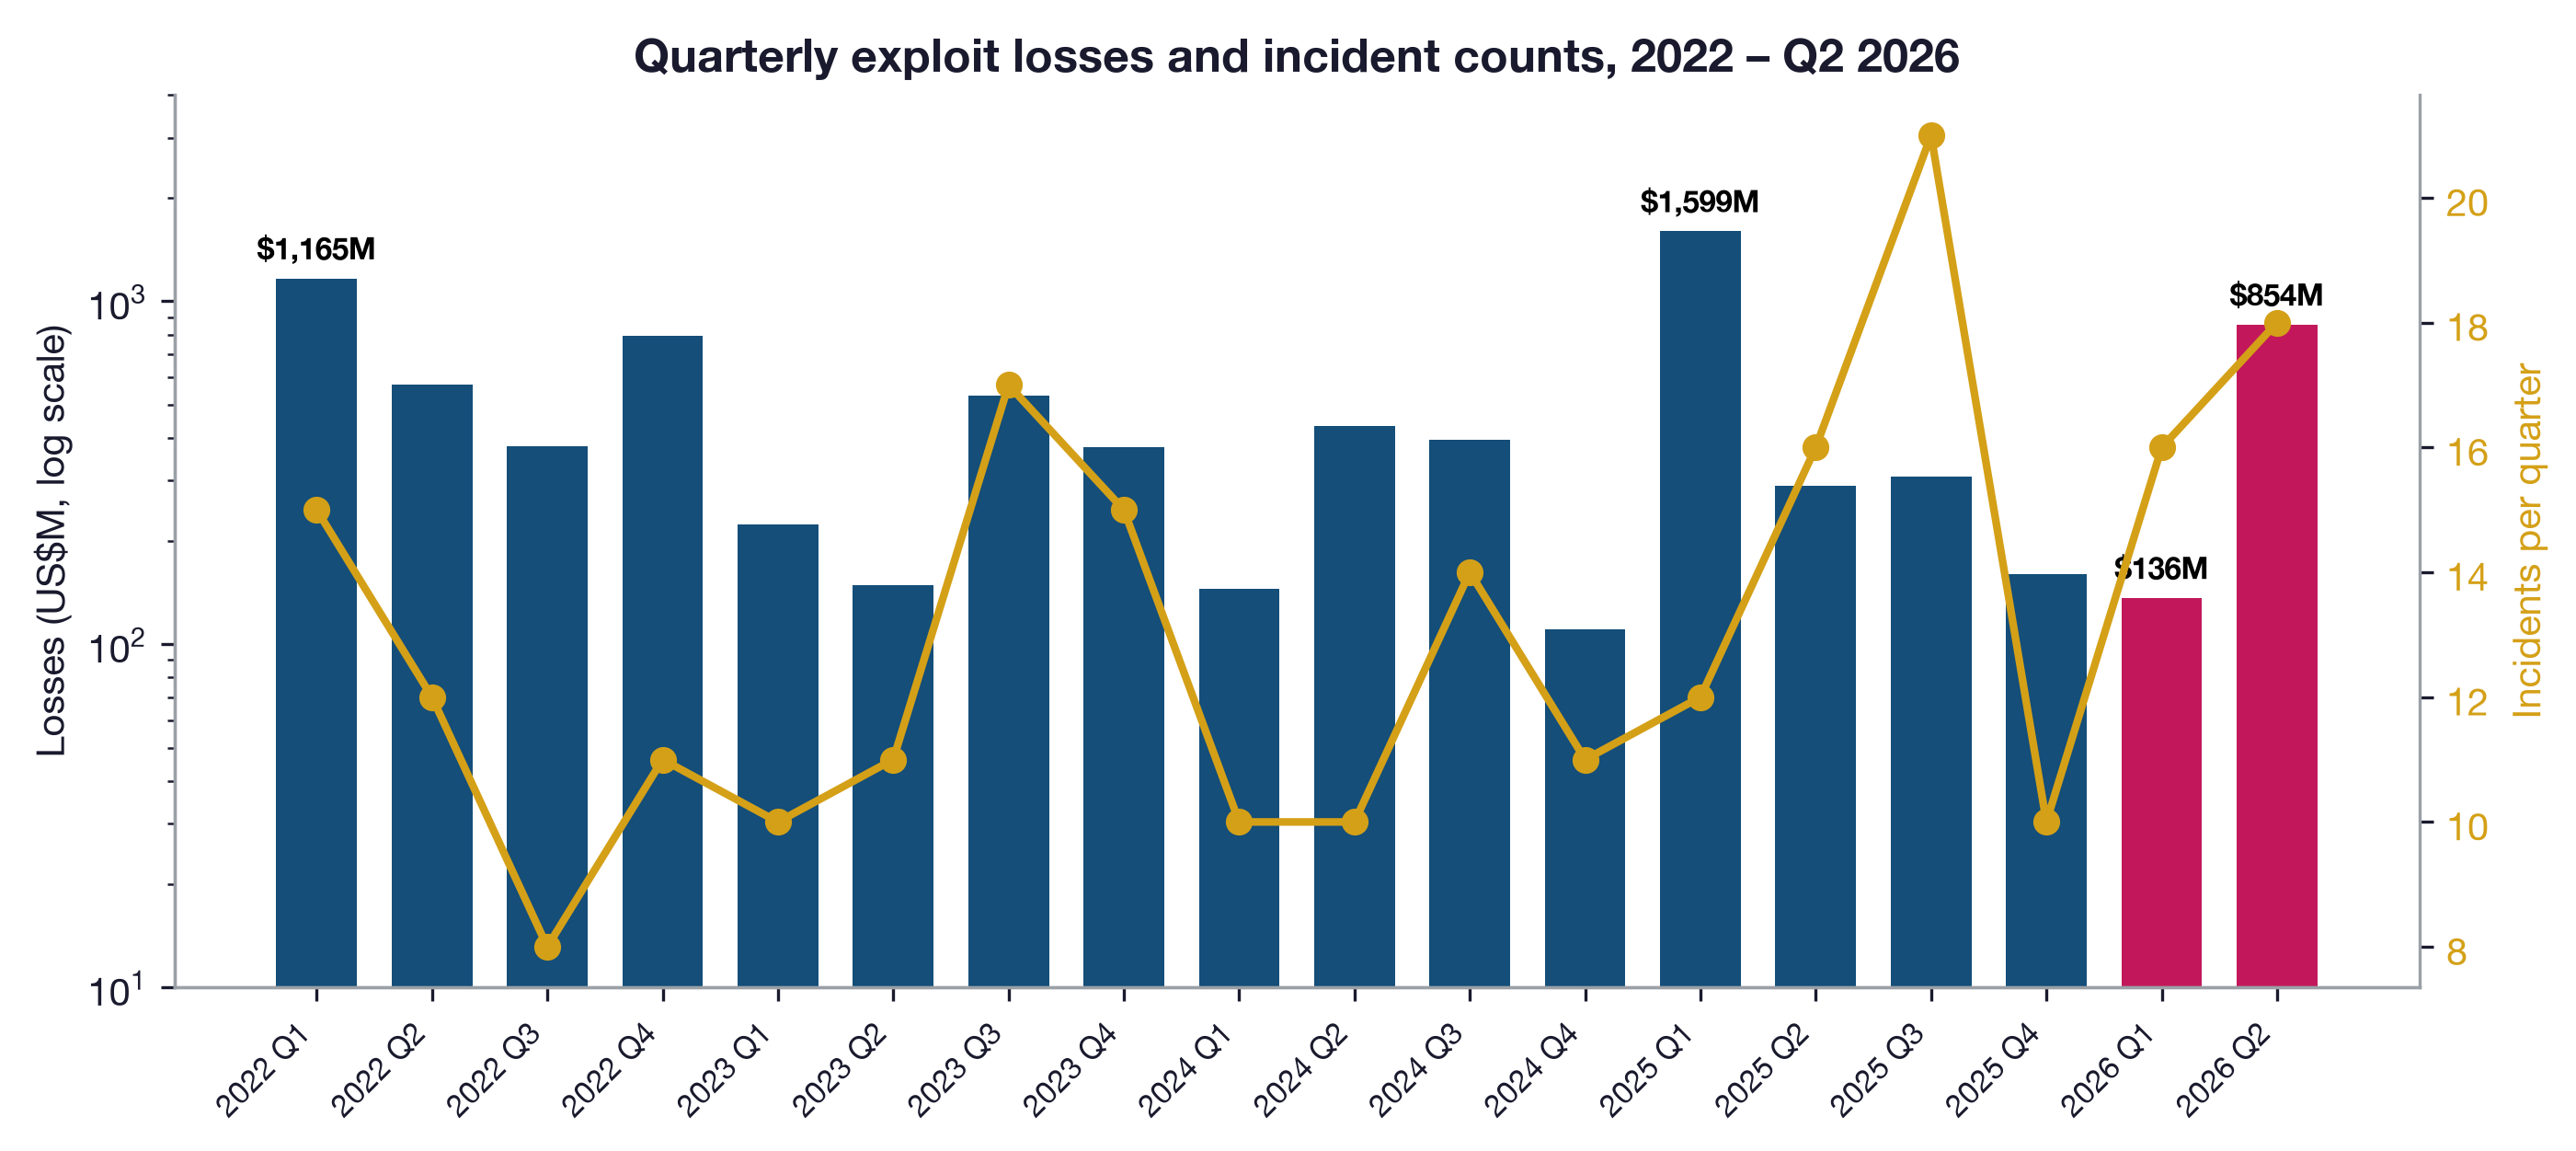
Quarterly exploit losses (bars, log scale) and incident counts (line). The two 2026 quarters are highlighted: the quietest quarter in the dataset, followed by reversion to the historical pace.
What one quarter can and cannot tell you
The side-by-side view of the two 2026 quarters makes the point better than any summary statistic. In Q1, losses were small and spread across code-level categories. In Q2, two familiar operational categories absorbed the overwhelming majority of the money. Note the ten-fold difference in axis scale between the panels.
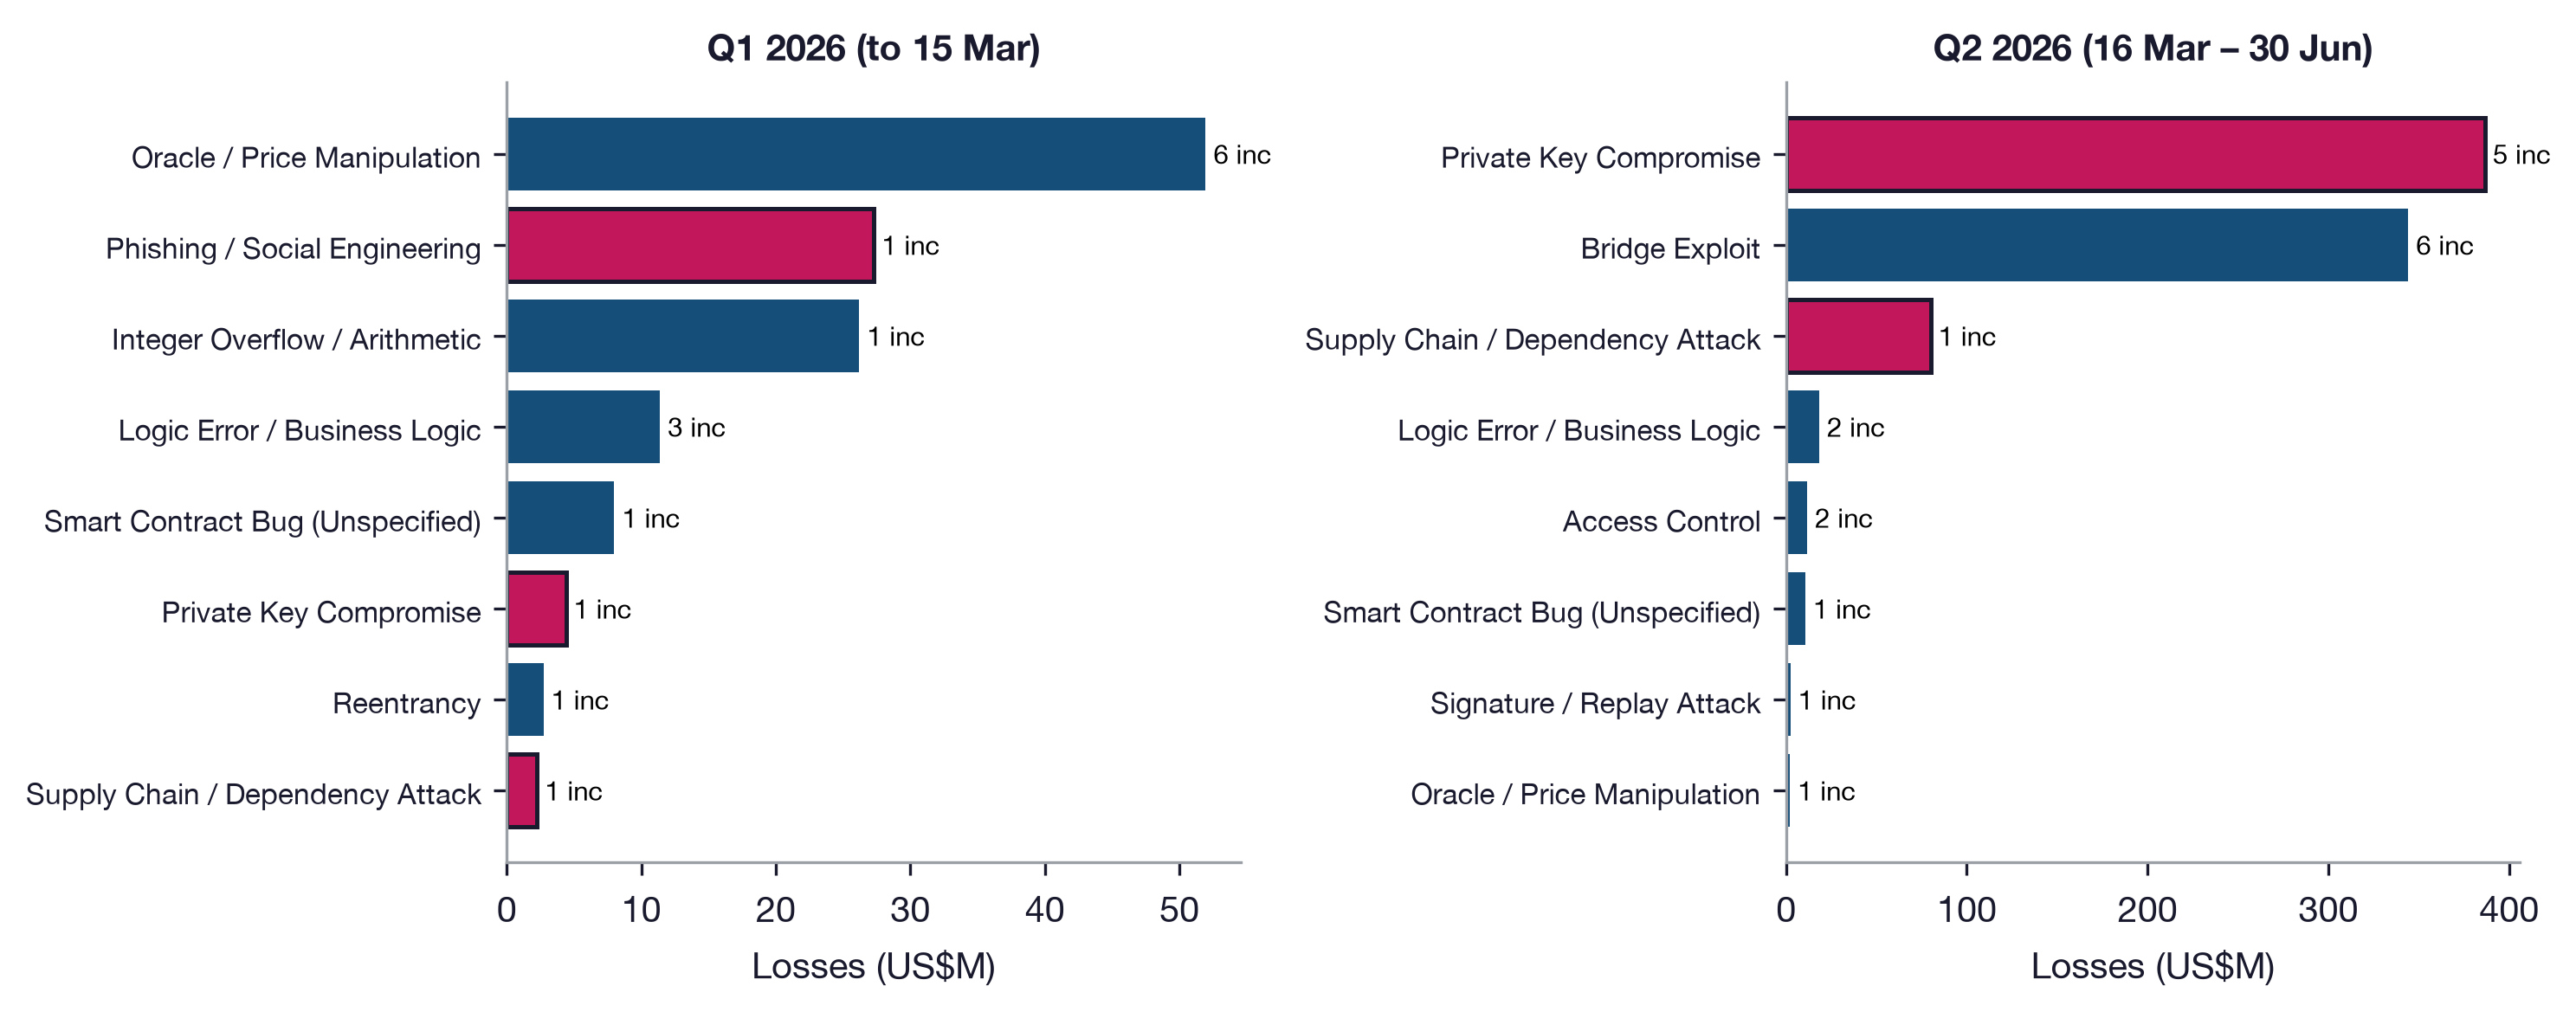
Incident losses by root cause in Q1 versus Q2 2026. Human-vector root causes are outlined. The x-axes differ by an order of magnitude.
This is why the study insists on multi-year windows. Realised losses are heavy-tailed: eight incidents account for 46.6 percent of all losses in four and a half years. Any single quarter is dominated by whether a tail event happened to land in it, and a quiet quarter tells you almost nothing about the next one. The structural drivers of the human-vector pattern, centralised custody concentrations, multi-signature approval interfaces, cross-chain liquidity pooled behind bridge contracts, and dependency-heavy build pipelines, were unchanged throughout the quiet spell. When attacker activity resumed its normal cadence, the losses returned to the same places.
Two structural details from the quarter
First, seventeen of the eighteen exploited protocols had been audited. That is not an indictment of auditing; it is a measurement of scope. Key custody, signer workflows, bridge operator infrastructure, and dependency pipelines sit outside what a contract audit reviews, and that is where the money was lost. This has been the study’s central finding for four years, and Q2 re-confirmed it after Q1 briefly suggested otherwise.
The updated full-window picture is unchanged in shape: the categories auditors report most and the categories that lose the most money remain different lists, with access control the only category prominent on both sides.
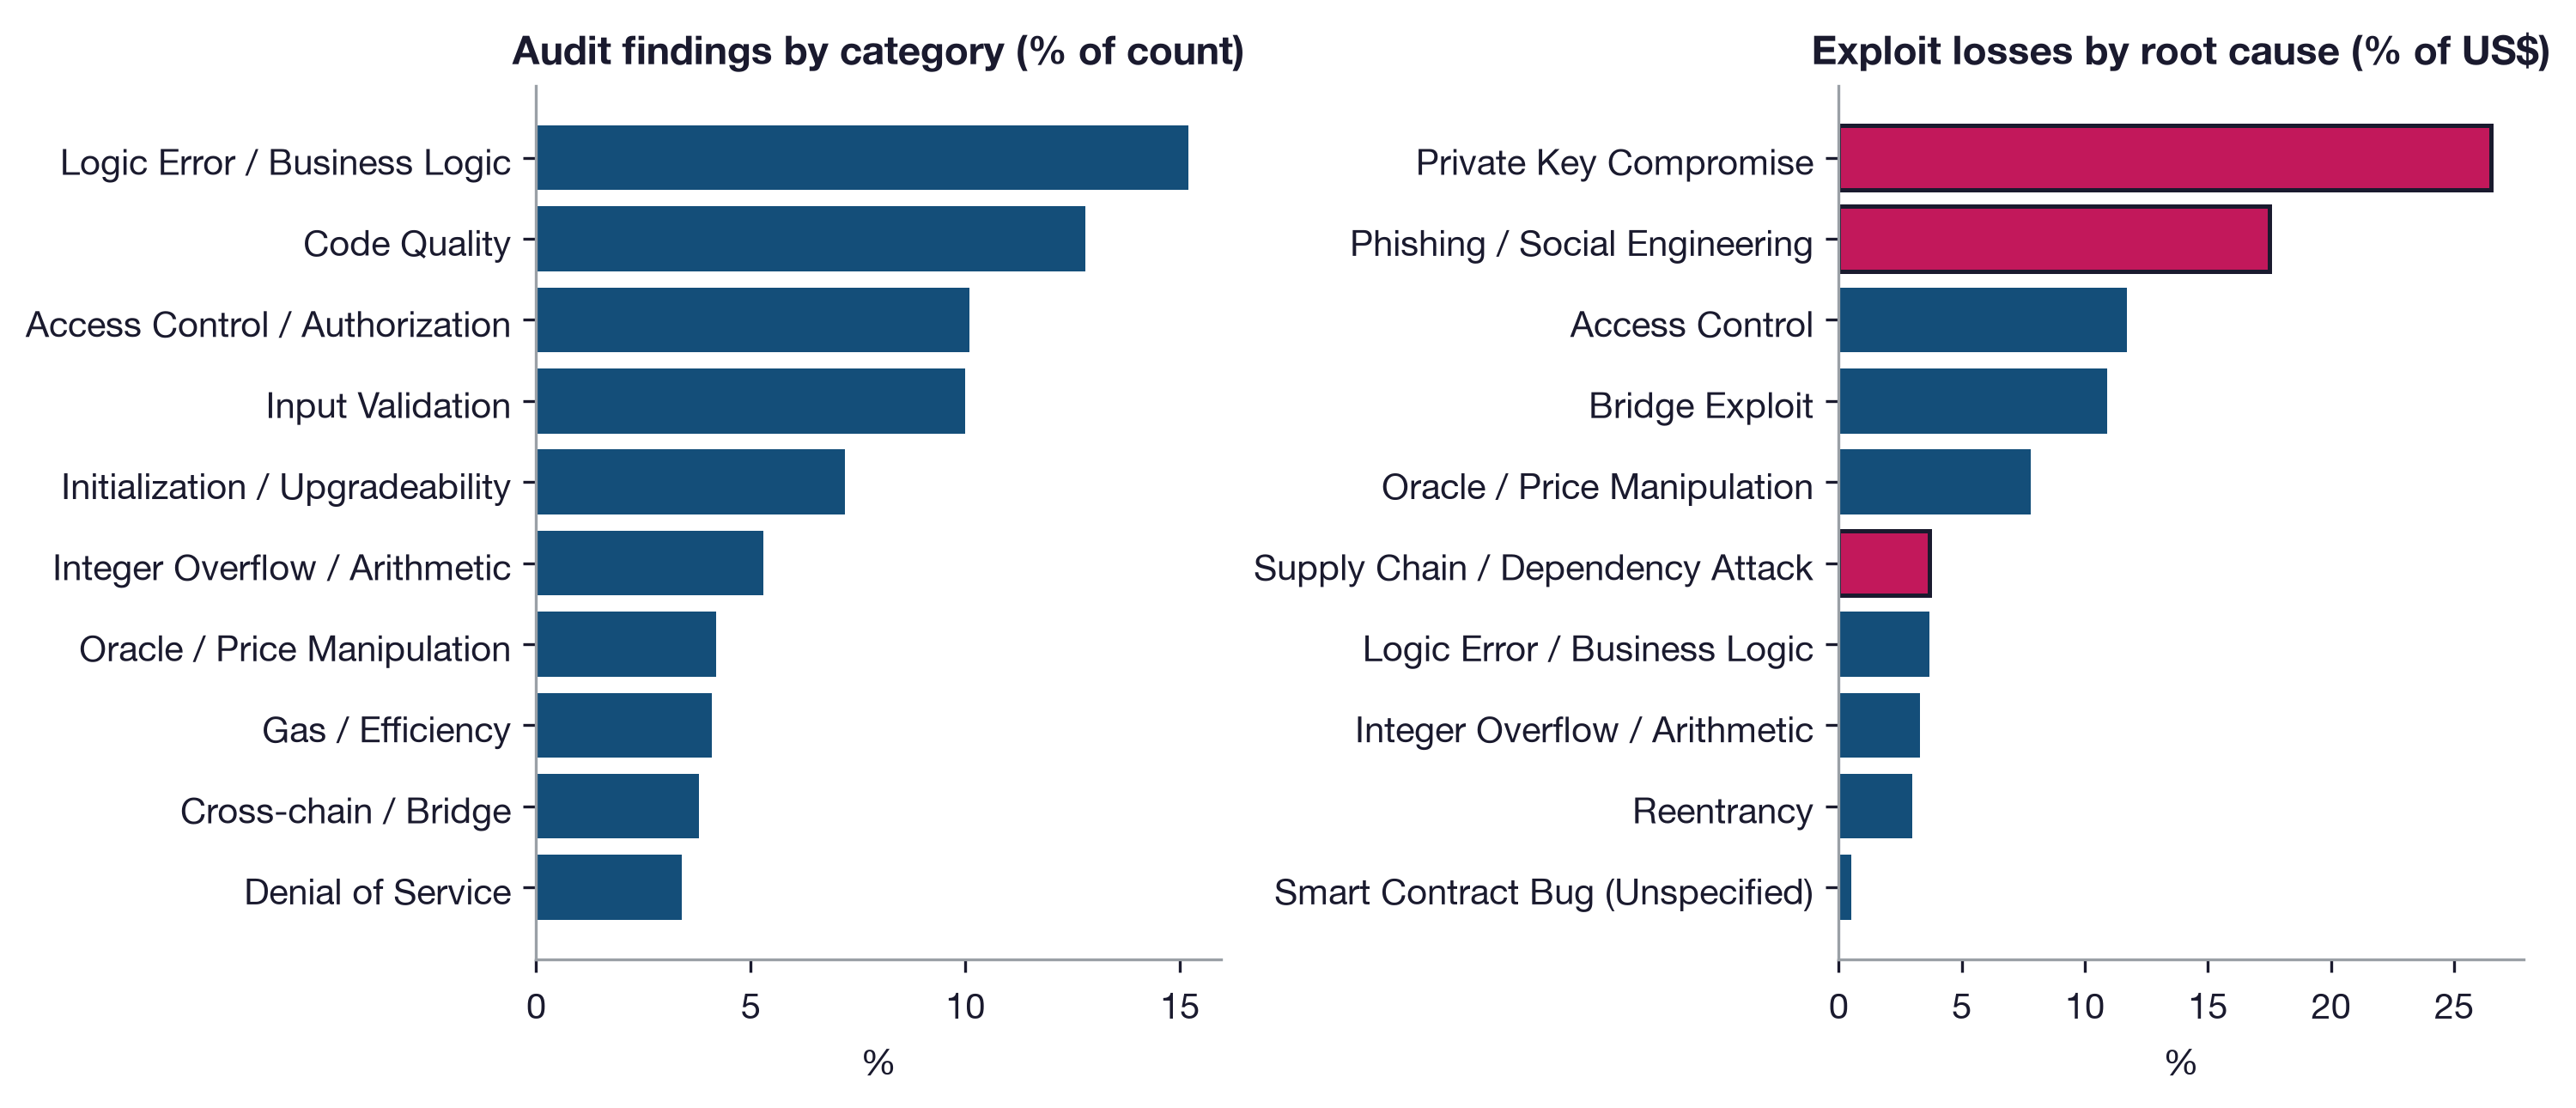
Left: audit findings by category, share of 25,706 findings. Right: realised exploit losses by root cause, share of US$8.62B. Human-vector categories outlined.
Second, the quarter’s incidents spread across nine chains: Ethereum, BNB Chain, Solana, Sui, NEAR, Polkadot, Cosmos, THORChain, and Base. That is the broadest chain distribution of any window in the dataset. Ethereum and BNB Chain still hold 88 percent of all incidents historically, but the tail is widening. Attacker attention follows value, and value is dispersing.
What the audit data says
The audit side of the updated dataset tells a steadier story, which is itself the finding. Audit output for the half-year reached 4,116 findings from 18 firms, an annualised pace above the full 2025 total. The 2025 market contraction has at minimum stopped.
Composition-wise, the industry appears to track the incident record with a lag of a quarter or two. Signature and replay findings doubled as a share of output in Q1, plausibly the audit industry re-examining multisig approval flows after Bybit. In Q2 that moderated, and cross-chain and bridge findings rose to 5.8 percent of output, their highest share since 2023, in the same quarter that bridge exploits led incident counts. Auditors are looking where the losses are. The problem is that the largest losses keep occurring in places a code review cannot reach.
The Critical-plus-High share of findings, the simplest proxy for how much serious material audits surface, remains where it has been since 2023: within a few points of 16 percent. Four and a half years of data show no regime change in what code review finds. The regime change happened on the loss side, in 2023, when human-vector attacks became the dominant loss driver, and it has not reversed.
What teams should take from this
Three practical conclusions, none of them new, all of them re-confirmed this quarter.
If you custody significant value, your key management and signer workflow are your primary attack surface, not your contract code. The two largest Q2 losses were key compromises at audited protocols. The mean private-key incident in our dataset costs US$46 million; the category has now produced US$2.28 billion in losses across fifty incidents.
If you operate or integrate a bridge, treat it as the highest-tail-risk component in your architecture. Bridges account for 12 percent of incidents in our dataset but 29 percent of losses. Q2 added six more bridge events, including the quarter’s largest single loss.
If your risk model assumes losses cluster around the mean, it is wrong. Eight incidents account for 46.6 percent of all losses in four and a half years. Plan against the tail: the question is not the average cost of an incident in your category, but what the worst plausible one looks like.
The full updated report, covering January 2022 through June 2026 with complete methodology, figures, and tables, is free to download, and the underlying aggregates are explorable in the data dashboard. Incident data is used with the written permission of rekt.news; audit findings derive from the public output of 22 independent security firms, analysed in aggregate and without firm-level attribution.